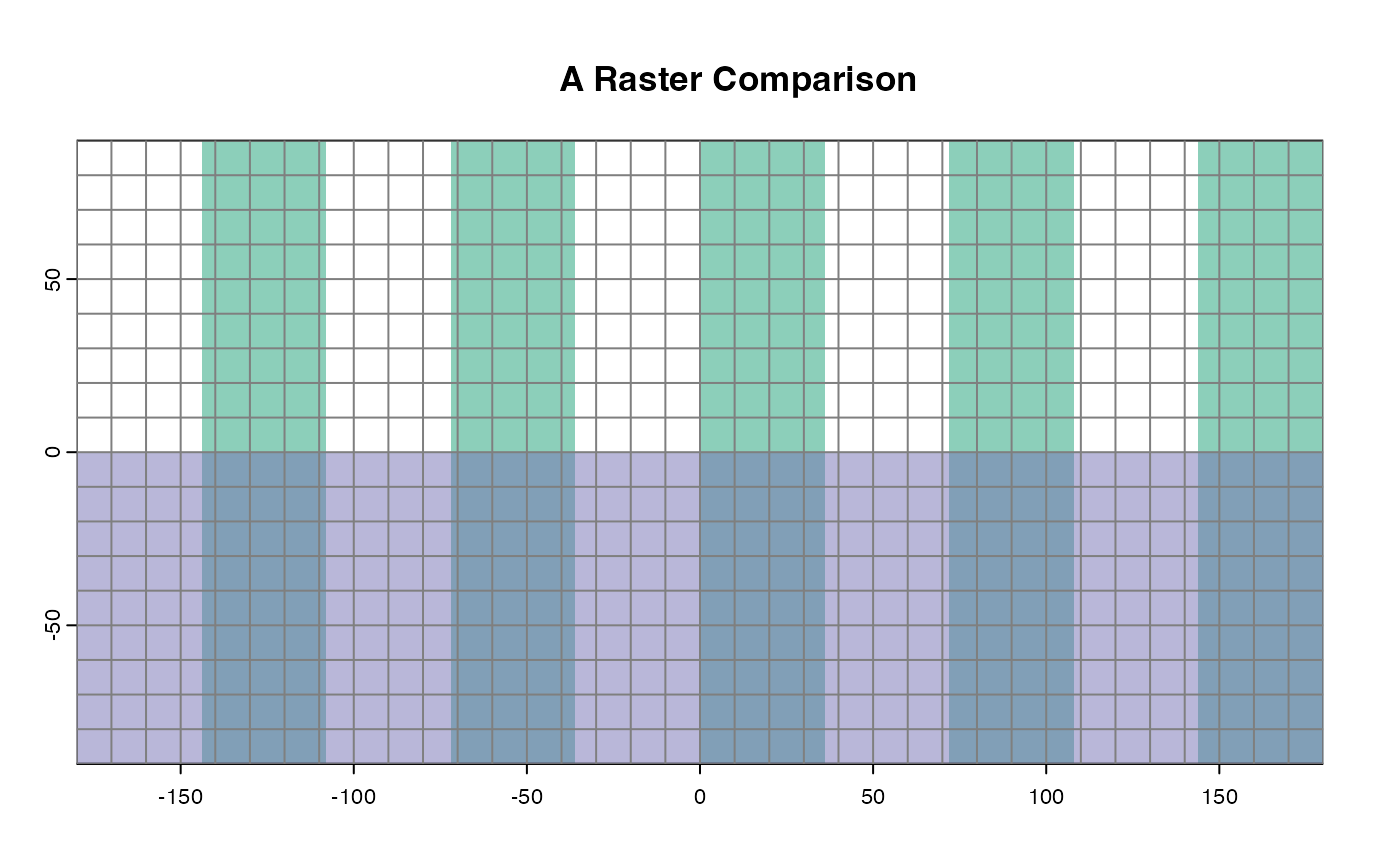
A convenient wrapper around terra::plot
to generate formatted plots comparing two rasters.
This is used in the context of voluModel to
overlay semi-transparent distributions (coded as 1)
in two different RasterLayers.
rasterComp(
  rast1 = NULL,
  rast2 = NULL,
  col1 = "#1b9e777F",
  col2 = "#7570b37F",
  rast1Name = "Set 1",
  rast2Name = "Set 2",
  land = NA,
  landCol = "black",
  title = "A Raster Comparison",
  graticule = TRUE,
  ...
)
Arguments
- rast1
A single
SpatRastershowing the distribution of the species corresponding torast1Name. Should have values of 0 (absence) and 1 (presence). Can also beNULL.- rast2
A single
SpatRastershowing the distribution of the species corresponding torast2Name. Should have values of 0 (absence) and 1 (presence). Must match the extent and resolution ofrast1. Can also beNULL.- col1
Color for
rast1presences- col2
Color for
rast2presences- rast1Name
An optional name for the first set of occurrences, which will be color-coded to
occs1Colin the resulting plot.- rast2Name
An optional name for the first set of occurrences, which will be color-coded to
occs2Colin the resulting plot.- land
An optional coastline polygon shapefile of types
sforSpatRasterto provide geographic context for the occurrence points.- landCol
Color for land on map.
- title
A title for the plot.
- graticule
Do you want a grid of lon/lat lines?
- ...
Additional optional arguments to pass to
terra::plot().
Value
A plot of class recordedplot overlaying mapped,
semitransparent extents of the input rasters
Note
The extents of rast1 and rast2
must match.