A convenient wrapper around ggplot to generate formatted occurrence point plots.
pointMap(
  occs,
  spName,
  land = NA,
  ptCol = "#bd0026",
  landCol = "gray",
  waterCol = "steelblue",
  ptSize = 1,
  verbose = TRUE,
  ...
)
Arguments
- occs
A
data.framewith at least two columns named "longitude" and "latitude" or that can be coerced into this format.- spName
A character string with the species name to be used in the plot title.
- land
An optional coastline polygon shapefile of types
sforSpatRasterto provide geographic context for the occurrence points.- ptCol
Color for occurrence points on map
- landCol
Color for land on map
- waterCol
Color for water on map
- ptSize
numericvalue forcex; size of occurrence points on map.- verbose
logical. Switching toFALSEmutes message describing which columns inoccsare interpreted as x and y coordinates.- ...
Additional optional arguments to pass to
ggplotinitial plot object.
Value
A ggplot plot object.
See also
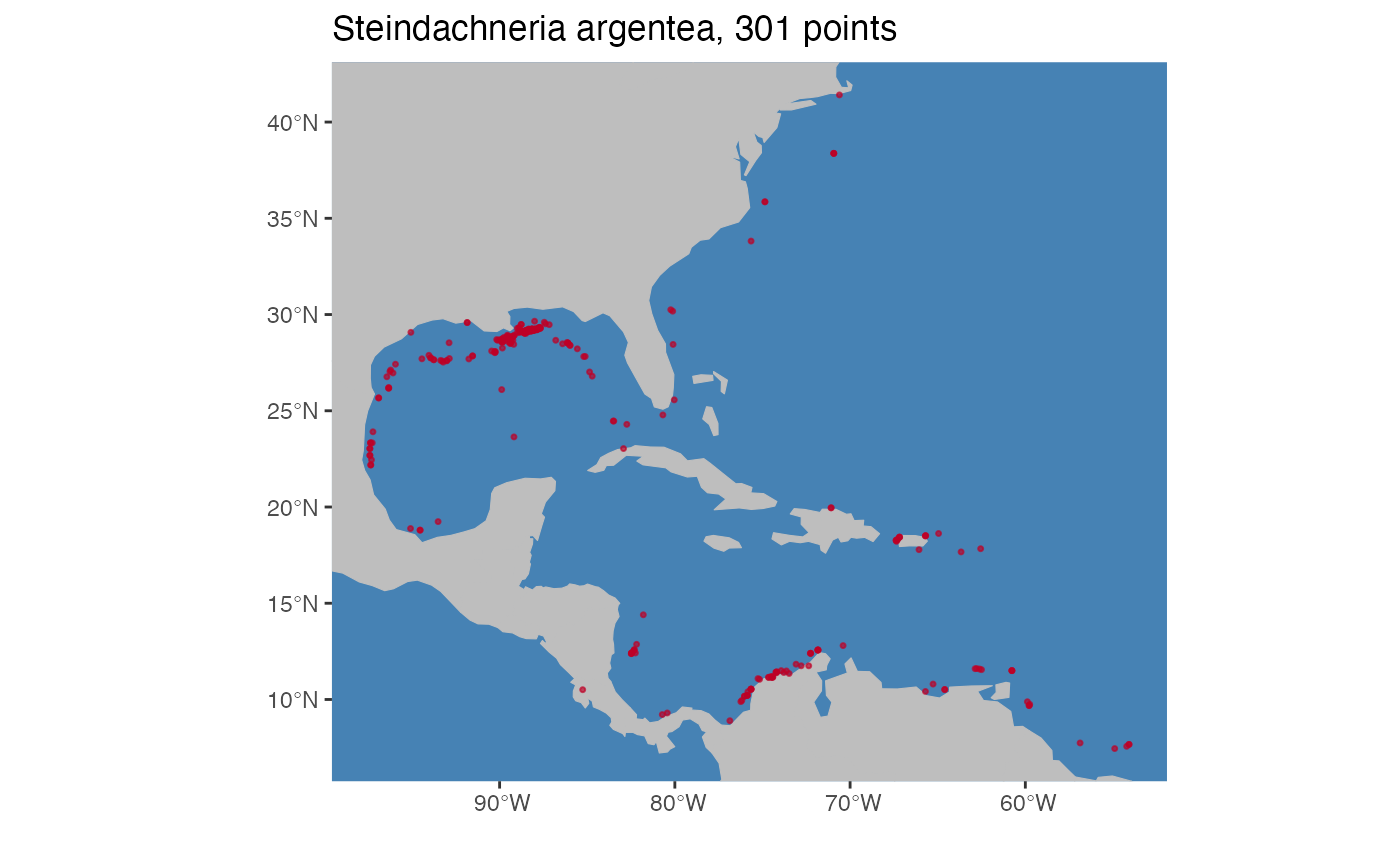
Examples
occs <- read.csv(system.file("extdata/Steindachneria_argentea.csv",
                             package='voluModel'))
spName <- "Steindachneria argentea"
pointMap(occs = occs, spName = spName,
         land = rnaturalearth::ne_countries(scale = "small",
                                            returnclass = "sf")[1])
#> Using decimalLongitude and decimalLatitude
#>  as x and y coordinates, respectively.
#> Warning: Use of `occs[[xIndex]]` is discouraged.
#> ℹ Use `.data[[xIndex]]` instead.
#> Warning: Use of `occs[[yIndex]]` is discouraged.
#> ℹ Use `.data[[yIndex]]` instead.