A convenient wrapper around ggplot
to generate formatted plots comparing two sets of
occurrence point plots.
pointCompMap(
  occs1,
  occs2,
  spName,
  land = NA,
  occs1Col = "#bd0026",
  occs2Col = "#fd8d3c",
  agreeCol = "black",
  occs1Name = "Set 1",
  occs2Name = "Set 2",
  landCol = "gray",
  waterCol = "steelblue",
  ptSize = 1,
  verbose = TRUE,
  ...
)
Arguments
- occs1
A
data.framewith at least two columns named "longitude" and "latitude" or that can be coerced into this format.- occs2
A
data.framewith at least two columns named "longitude" and "latitude" or that can be coerced into this format.- spName
A character string with the species name to be used in the plot title.
- land
An optional coastline polygon shapefile of types
sforSpatRasterto provide geographic context for the occurrence points.- occs1Col
Color for occurrence points on map
- occs2Col
Color for occurrence points on map
- agreeCol
Color for occurrence points shared between
occs1andoccs2.- occs1Name
An optional name for the first set of occurrences, which will be color-coded to
occs1Colin the resulting plot.- occs2Name
An optional name for the first set of occurrences, which will be color-coded to
occs2Colin the resulting plot.- landCol
Color for land on map
- waterCol
Color for water on map
- ptSize
numericvalue forcex; size of occurrence points on map.- verbose
logical. Switching toFALSEmutes message describing which columns inoccs1andoccs2are interpreted as x and y coordinates.- ...
Additional optional arguments to pass to
ggplotinitial plot object.
Value
A ggplot plot object.
Note
The x and y column names of occs1 and occs2
must match.
See also
Examples
set.seed(5)
occs <- data.frame(cbind(decimalLatitude = sample(seq(7,35), 24),
decimalLongitude = sample(seq(-97, -70), 24)))
set.seed(0)
occs1 <- occs[sample(1:nrow(occs),
size = 12, replace = FALSE),]
set.seed(10)
occs2 <- occs[sample(1:nrow(occs),
size = 12, replace = FALSE),]
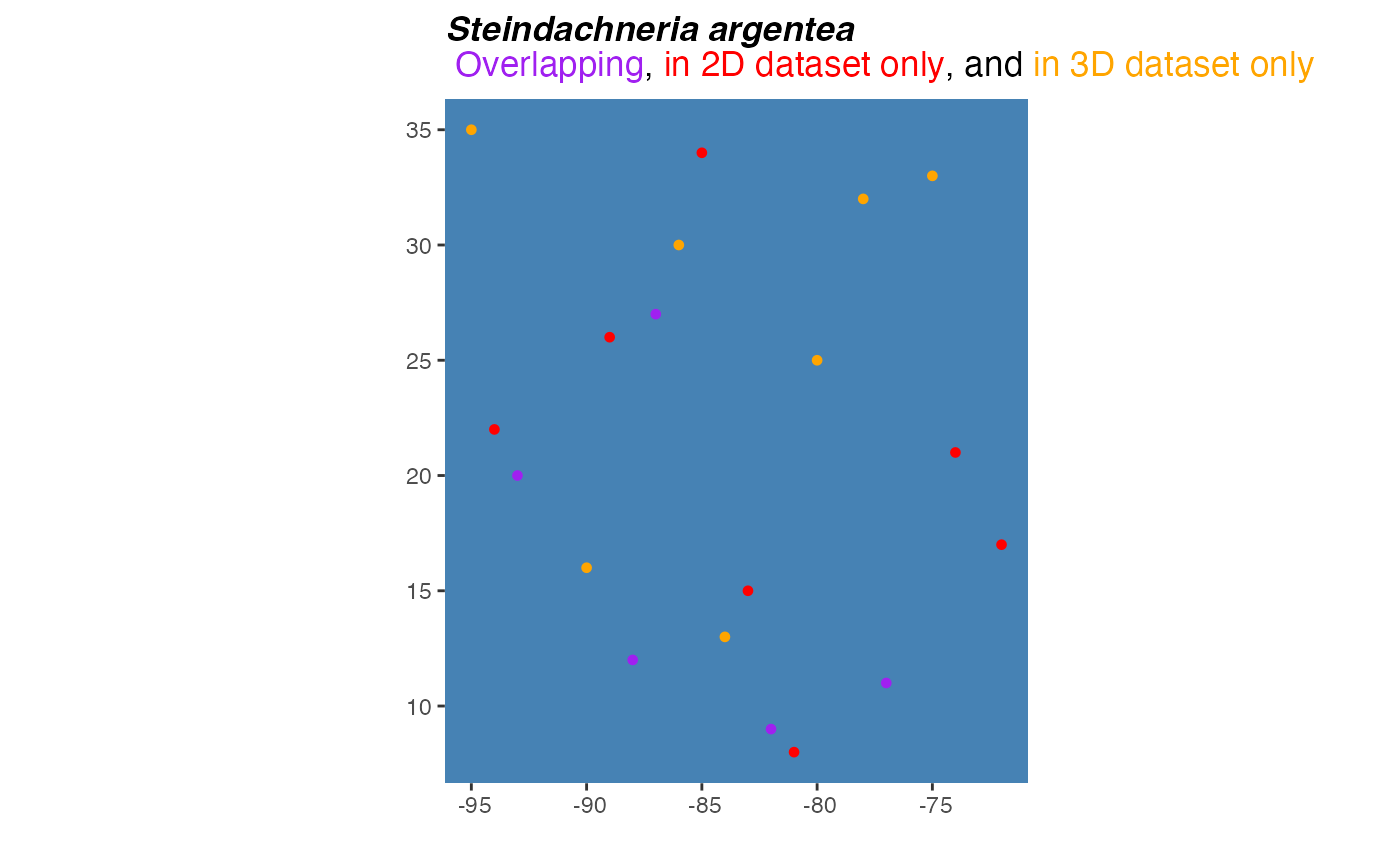
pointCompMap(occs1 = occs1, occs2 = occs2,
occs1Col = "red", occs2Col = "orange",
agreeCol = "purple",
occs1Name = "2D",
occs2Name = "3D",
waterCol = "steelblue",
spName = "Steindachneria argentea",
ptSize = 2,
verbose = FALSE)
#> Warning: Use of `occ_dat[[occ_datIndices$xIndex]]` is discouraged.
#> ℹ Use `.data[[occ_datIndices$xIndex]]` instead.
#> Warning: Use of `occ_dat[[occ_datIndices$yIndex]]` is discouraged.
#> ℹ Use `.data[[occ_datIndices$yIndex]]` instead.