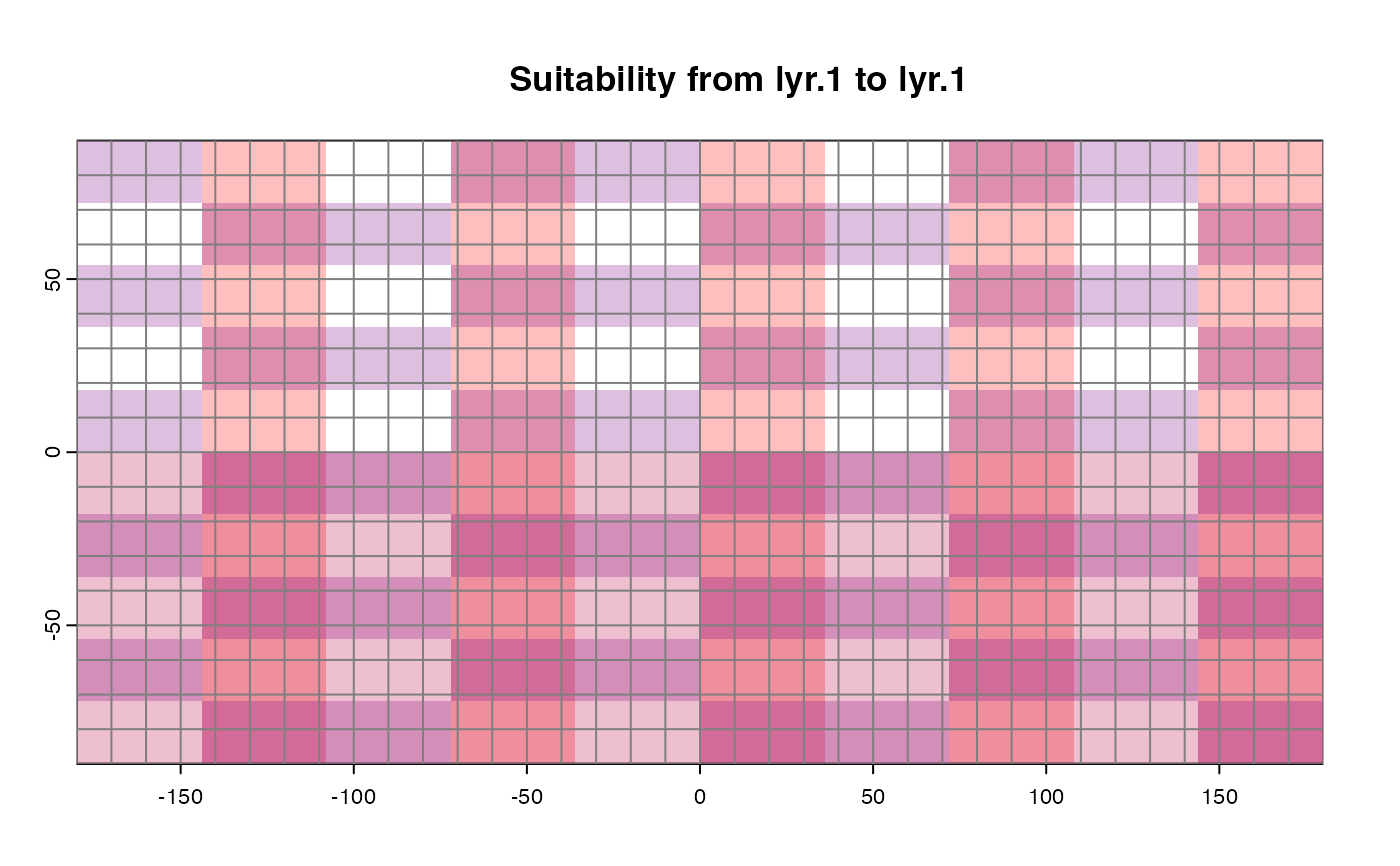
This script plots a semitransparent layer of suitable habitat for each depth layer. The redder the color, the shallower the layer, the bluer, the deeper. The more saturated the color, the more layers with suitable habitat.
plotLayers(
  rast,
  land = NA,
  landCol = "black",
  title = NULL,
  graticule = TRUE,
  ...
)
Arguments
- rast
A
SpatRastervector with the 3D presence/absence distribution of a species (interpreted as 1 = presence, 0 = absence).- land
An optional coastline polygon shapefile of types
sforSpatRasterto provide geographic context for the occurrence points.- landCol
Color for land on map.
- title
A title for the plot. If not title is supplied, the title "Suitability from (MINIMUM DEPTH) to (MAXIMUM DEPTH)" is inferred from names of
rast.- graticule
Do you want a grid of lon/lat lines?
- ...
Additional optional arguments.
Value
A plot of class recordedplot
Note
Only include the depth layers that you actually want to plot.