A convenient wrapper around ggplot
to generate a formatted plot of a single raster.
oneRasterPlot(
rast,
land = NA,
landCol = "black",
scaleRange = NA,
graticule = TRUE,
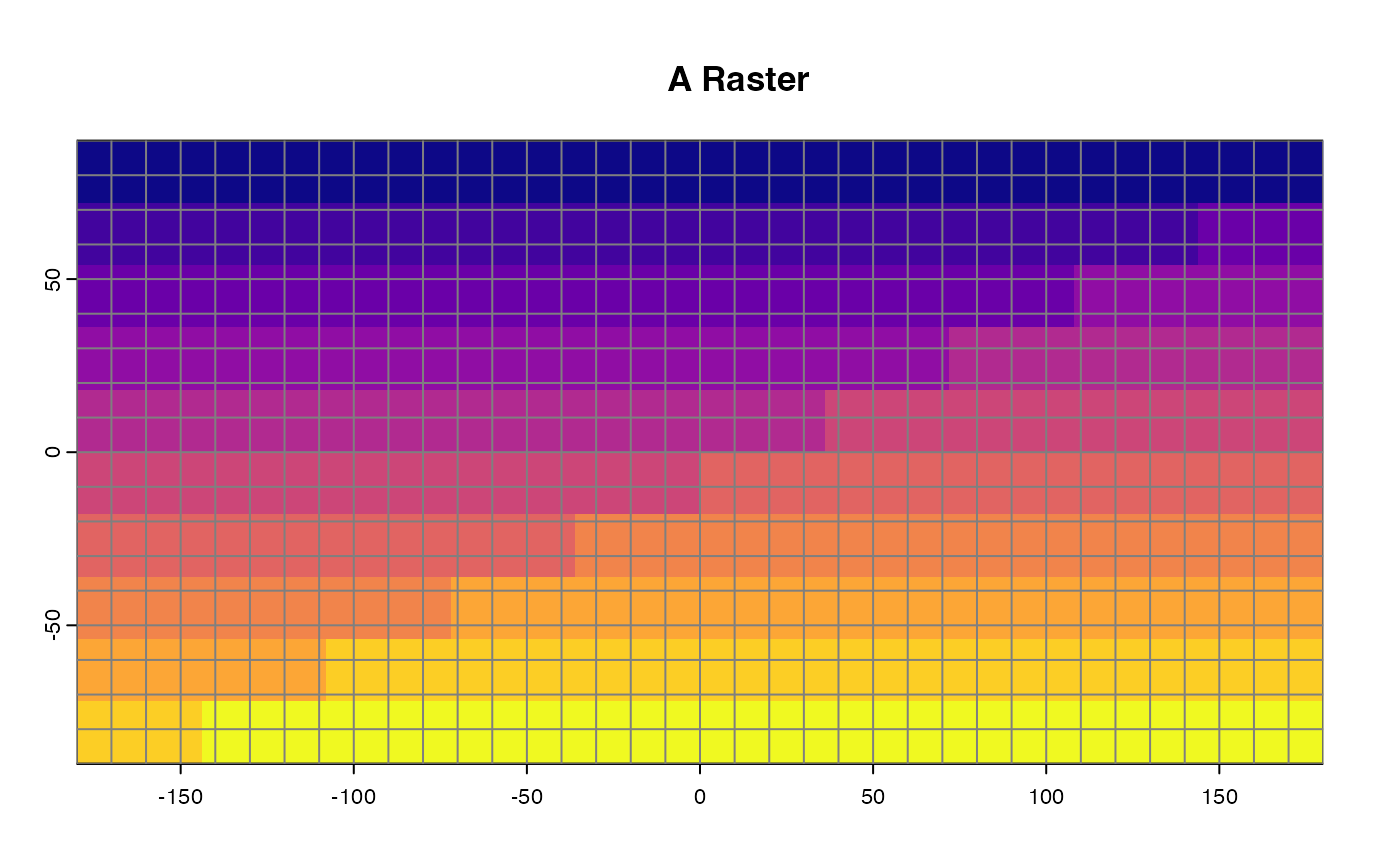
title = "A Raster",
verbose = TRUE,
...
)Arguments
- rast
A single
SpatRasterlayer on a continuous scale.- land
An optional coastline polygon shapefile of types
sforSpatRasterto provide geographic context for the occurrence points.- landCol
Color for land on map.
- scaleRange
Optional numeric vector containing maximum and minimum values for color scale. Helpful when making multiple plots for comparison. Defaults to minimum and maximum of input
rast.- graticule
logical. Do you want a grid of lon/lat lines?- title
A title for the plot.
- verbose
logical. Switching toFALSEmutes message alerting user if inputrastvalues exceed a specifiedscaleRange.- ...
Additional optional arguments to pass to
plotinitial plot object orviridis.
Value
A plot of mapping the values of the input raster layer